
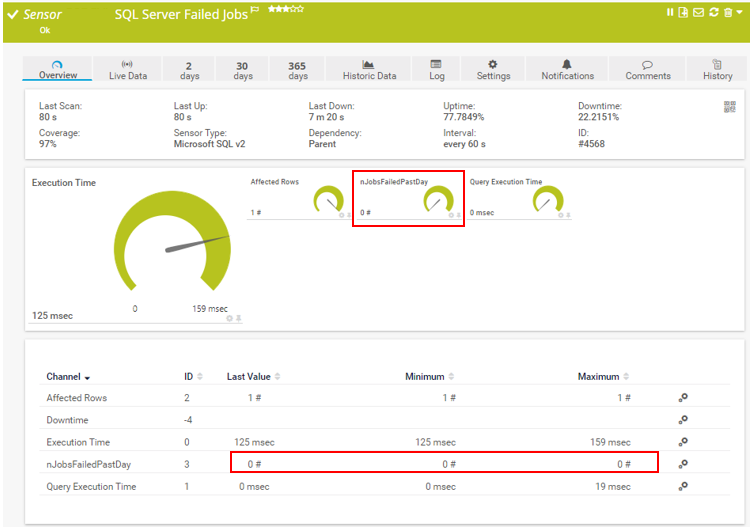
This week it was time to integrate SQL Server job failure detection with our SNMP server across all our SQL Server instances. PRTG Network Monitor is an SNMP server by Paessler. It is comparable to HP Openview, Cacti, Spiceworks, Solarwinds, Datadog and others. I really love this tool, even though it wakes me up in the middle of the night 😉 A Cisco network engineer at ANM, https://anm.com/, installed it and trained us. Their NOC in Albuquerque used it to support servers and workstations for their customers. The typical use case for SNMP is for switches and routers. I’ve come to find it priceless for multi-tier application troubleshooting, creating a single pane of glass for locating issues in our enterprise. I’ll outline how to add this sensor. The end result looks like this:
SQL Script Design
To get the status of the SQL Server agent jobs I’m using a script adapted from Gaurav Lal at gauravlal.wordpress.com. The script at that link includes several unneeded details including the name and the time of the job. PRTG needs a much more condensed query with a numeric result. The goal is to produce a number that can be tracked over time. I’ll save the query to a file called sysjobhistory.sql. This query, shown below, is a condensed version that gives us the number of jobs that have failed in the past day:
SELECT

count(*) AS nJobsFailedPastDay

FROM

msdb..sysjobhistory sjh

INNER JOIN

msdb..sysjobs sj

ON sjh.job_id = sj.job_id

WHERE

sjh.run_status NOT IN (1, 4) AND

sjh.step_id <> 0 AND

sjh.run_date >= CONVERT(CHAR(8), getdate(), 112);
This query will stay at ‘1’ for 24 hours if a single job fails, which is simultaneously an advantage and a disadvantage.
The advantage is that the sensor will stay red for the day giving ample warning that there was a problem with an agent job for a day and not just go back to 0 immediately. It will go back to 0 within a day which should be enough time for the dba to resolve the issue causing the failed job. In conjunction with the sensor, there are e-mail notifications from the SNMP server that should provide ample warning that there was a problem. That being said, there are a few things a dba can do to deliberately or accidentally clear the flag faster. Clearing the flag early is not necessary. If the job is disabled or deleted in the agent then the query result will return to 0. So if the backup job fails, we can just delete the backup job and the alert will go away. Yeah, problem solved! A more subtle disadvantage is that a red sensor will stick around for a day like a scarlet letter allowing other syadmins to see the label on the database server and associate a red sensor of shame because of a failed job. In the past, I’ve been able to resolve the underlying problems causing a failed job in minutes, or an hour or two at worst, however, the sensor will still stay red all day. The number value from the query will continue to increase if a job goes back to a failed status later on in the day.
SQL Script Load to Server
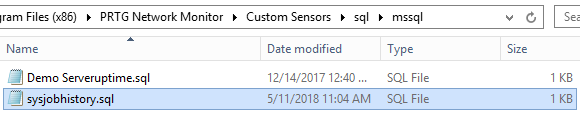
Older versions of Paessler PRTG used to allow scripts to be loaded and saved into the SNMP system directly from the web interface. The newer version needs custom SQL scripts to be loaded onto the SNMP server in a special folder. The script needs to be loaded here C:\Program Files (x86)\PRTG Network Monitor\Custom Sensors\sql\mssql
Add a SQL Account
We’ll add an account with just the permissions needed to query for the agent status in the msdb database in the sysjobs and sysjobshistory table.
USE [master]

GO

CREATE LOGIN [snmpaccount] WITH PASSWORD=N'opensesame', DEFAULT_DATABASE=[master], CHECK_EXPIRATION=OFF, CHECK_POLICY=OFF;

GRANT VIEW SERVER STATE TO [snmpaccount];

GO

USE [msdb]

GO

CREATE USER [snmpaccount] FOR LOGIN [snmpaccount];

ALTER USER [snmpaccount] WITH DEFAULT_SCHEMA=[dbo];

GO

DECLARE @Version NUMERIC(18,10);

SELECT @Version = LEFT(CAST(serverproperty('productversion') AS VARCHAR), 4);

IF @Version < 11  -- ALTER ROLE syntax for pre SQL 2012

BEGIN

EXEC sp_addrolemember N'db_datareader', N'snmpaccount';

EXEC sp_addrolemember N'SQLAgentReaderRole', N'snmpaccount';

END

ELSE -- ALTER ROLE syntax for post SQL 2012

BEGIN

EXEC sp_executesql N'ALTER ROLE [SQLAgentReaderRole] ADD MEMBER [snmpaccount];';

EXEC sp_executesql N'ALTER ROLE [db_datareader] ADD MEMBER [snmpaccount];';

END

GO
Test that the account works by running the query from a sqlcmd command line. This should return 0 if none of the jobs are in an error state.
sqlcmd -U snmpaccount -P opensesame -S SERVERNAME\INSTANCE -d master -Q "SELECT count(*) as nJobsFailedPastDay FROM msdb..sysjobhistory sjh INNER JOIN msdb..sysjobs sj ON sjh.job_id = sj.job_id WHERE sjh.run_status NOT IN (1, 4) AND sjh.step_id <> 0 AND sjh.run_date >= CONVERT(CHAR(8), getdate() - 1, 112);"
Add Database Credentials in PRTG
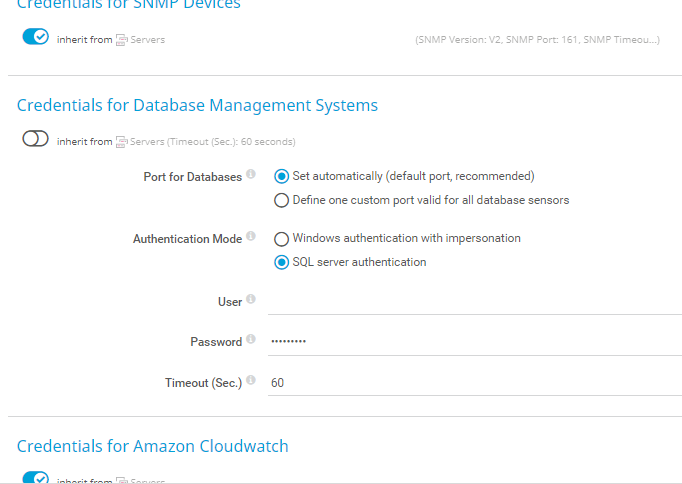
We’ll need to add the Credentials for the probe account to the Settings of the server in PRTG. Scroll down halfway in the settings. Then under Credentials for Database Management Systems set the slider to the left to stop inheriting from the default Servers configuration. Then add the SQL Server account like the image below.
Add SQL Sensor to PRTG
Now we can add the sensor to the database server in PRTG. In this example, I’m adding a sensor for the second instance on the database server. We’ll make another one just like it.
![]()
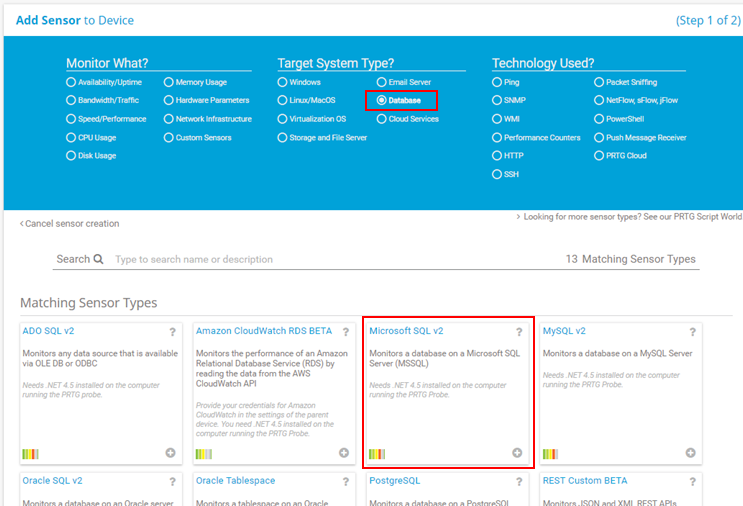
Next click [Add Sensor]
Then choose [(*) Database] in the middle section of available sensors. Then click the block for [Microsoft SQL v2].
Name the sensor “SQL Server Failed Jobs”, enter master for the database change the instance name to the name of the instance and choose the sysjobhistory.sql file in the dropdown list of available SQL files.
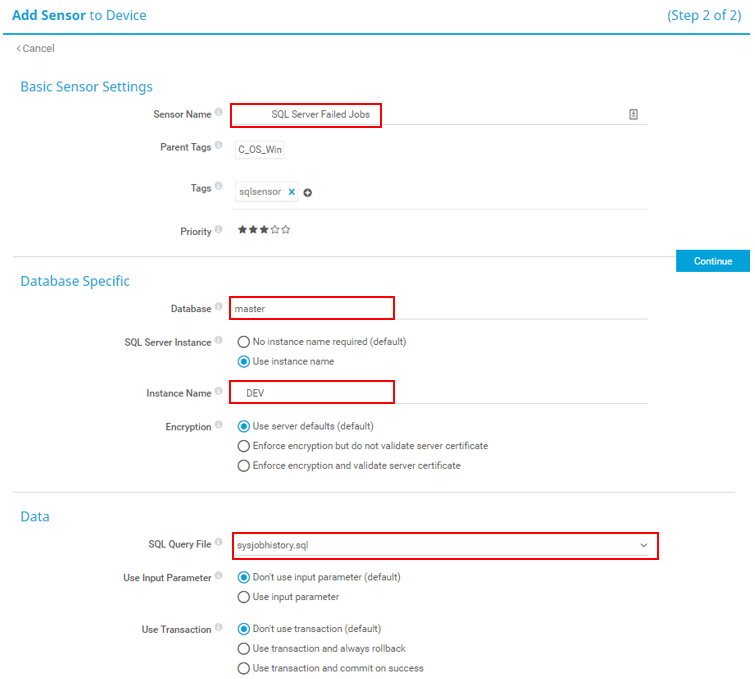
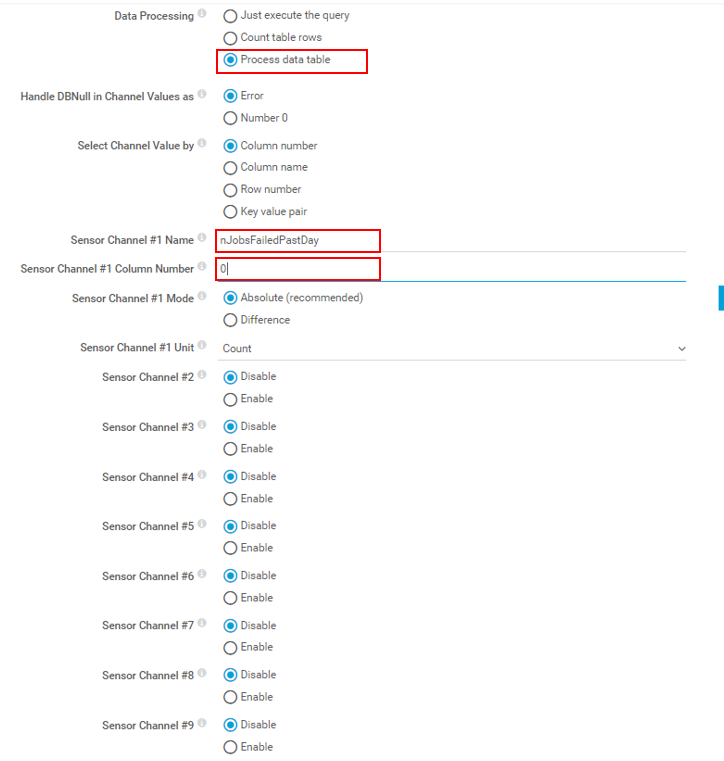
Scroll down. The next change is to [Data Processing]. We want to use the third radio button [(*) Process data Table]. We’ll name the Channel “nJobsFailedPastDay”. Lastly, we’ll use Column number 0.
Now click Continue to finish adding the new sensor.

The sensor display looks like this in PRTG
Set Alert thresholds.
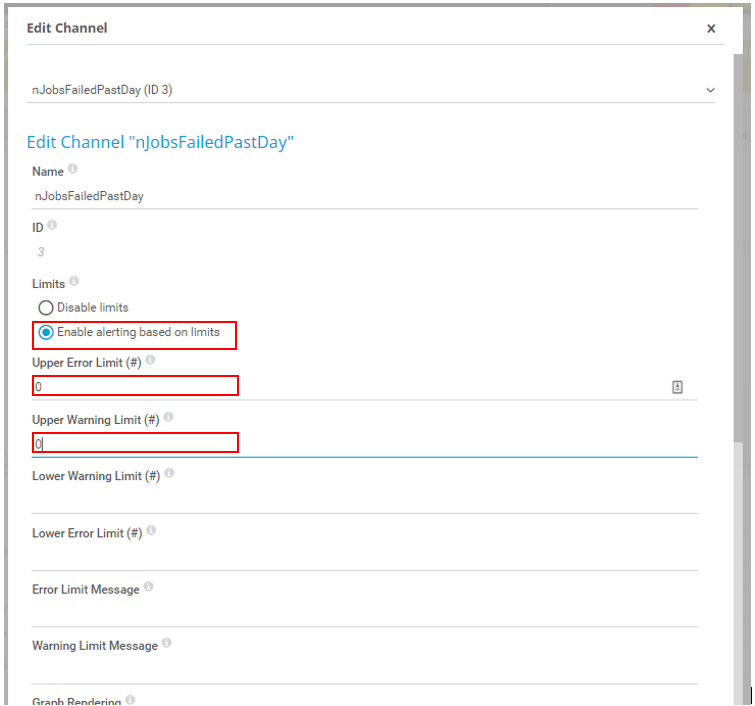
We want to be alerted if the value from the query ever changes from 0, so we Enable Limits on the nJobsFailedPast Day channel. To do this click on the dial for nJobsFailedPastDay, Click the radio button for Enable Alerting based on limits. Enter 0 for the Upper Error limit and 0 for the Upper warning limit.
Test
I’m skipping details here, but to watch this thing fail, just create and run a SQL agent job with a single step with some malformed SQL like
select @omg_this_is_a_fail;
Future changes
This might be a good use case for Service Broker. Polling the database with this little query lets us know pretty quickly if a job fails and doesn’t use many resources. But even though it’s very very small it’s still database and network resources being used every 60 seconds. Paessler has a Windows MSMQ Queue Length sensor, and I’m curious if I can glue together something with SQL Server Service Broker.
Another more likely change is querying other messages and database values and unioning with the original query to display multiple channels/values in the same sensor without using up additional sensors.